By BEUMER Group
We talked with Idar Sørgjerd, Head of Baggage Handling at Avinor about data-driven asset management and what it means for Oslo Airport.
Oslo Airport’s strategic ambitions
Oslo Airport is the largest of 43 airports that Avinor operates in Norway.
As the gateway to Norway, Avinor has big ambitions for Oslo Airport. Sørgjerd explains:
“We have visions of Oslo being a central Nordic hub airport in the future with traffic volumes passing 30 million passengers per year. We want to be in the top three airports in Europe for punctuality. And in keeping with what Norway has to offer in terms of its waterfalls, mountains and fjords, it’s very important for us to be a green airport.”
But, continues Sørgjerd, Norway is a country with a high cost of living, and matching high labour costs. So, when it came to investing in a new BHS as a key element of Oslo Airport’s development, Sørgjerd explains:
“We were looking for new technology that would enable the airport to use its resources more efficiently, within its existing building footprint, with lower O&M and spare parts costs and more predictable processes, in a way we could develop our existing and future revenue streams and meet our sustainability goals.”
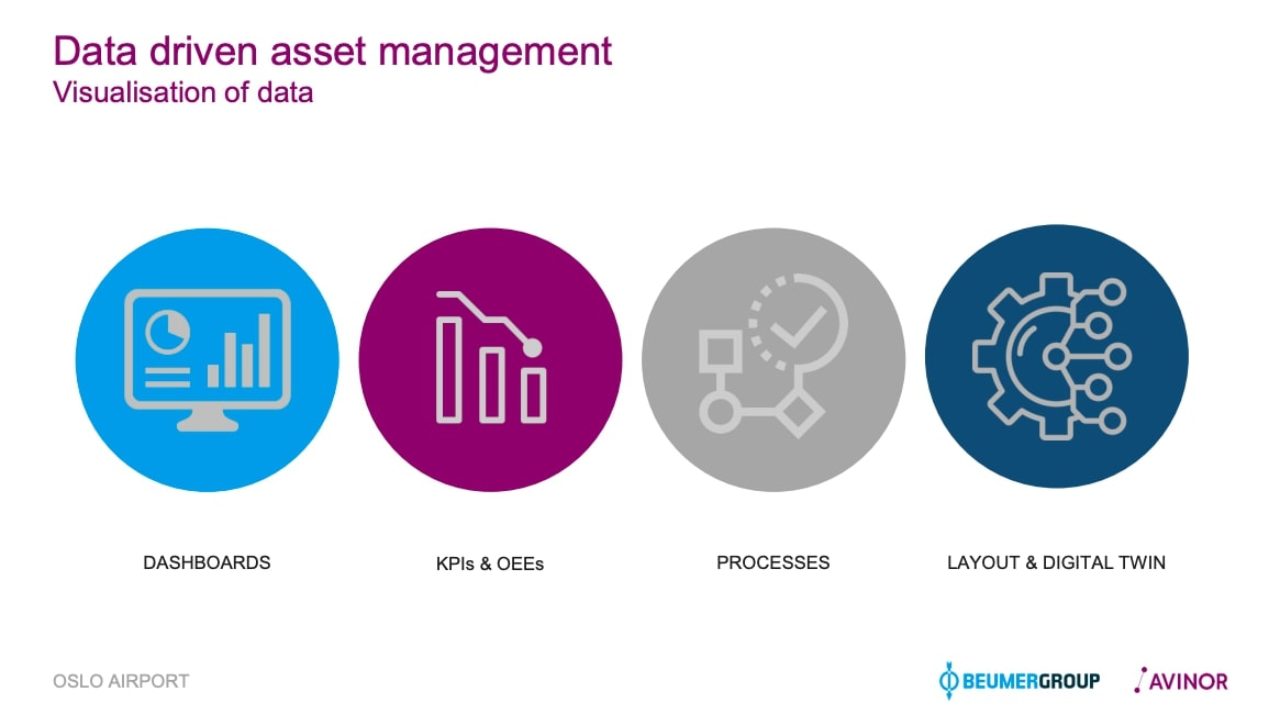
Investing in digital infrastructure
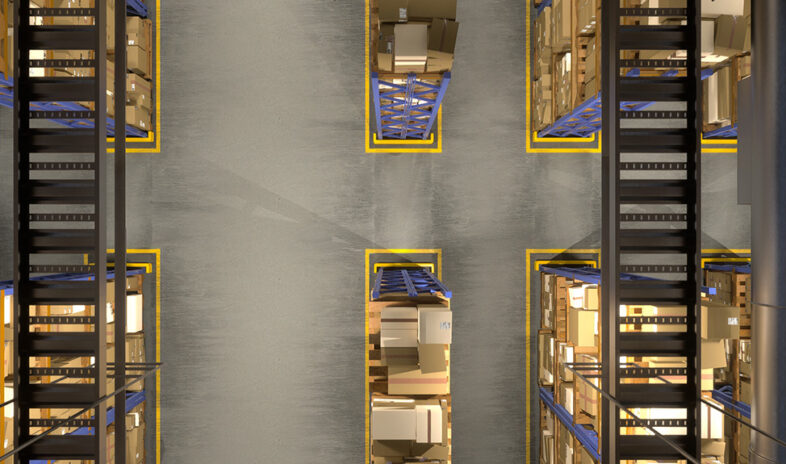
It was for these reasons that Avinor decided to invest in data and digital infrastructure when deciding on the advanced ICS BHS. It believes that the integration of the latest technology would help Oslo Airport in future-proofing its operations and enable it to deliver forward-thinking operations based on data-driven decisions.
By integrating the latest technology with its BHS, this is what Oslo is hoping to achieve, says Sørgjerd:
- No more system stops or bottlenecks.
- Moving from calendar-based maintenance to condition-based maintenance. The system can direct operators when elements need changing.
- Leaner and more flexible operation of the maintenance team. We have been able to reduce our maintenance team to just four workers per shift.
- Higher situational awareness so operators can understand what’s going on at any time.
- Higher system utilisation.
- Data-driven dialogue.
But how is digital infrastructure in baggage handling able to achieve this?
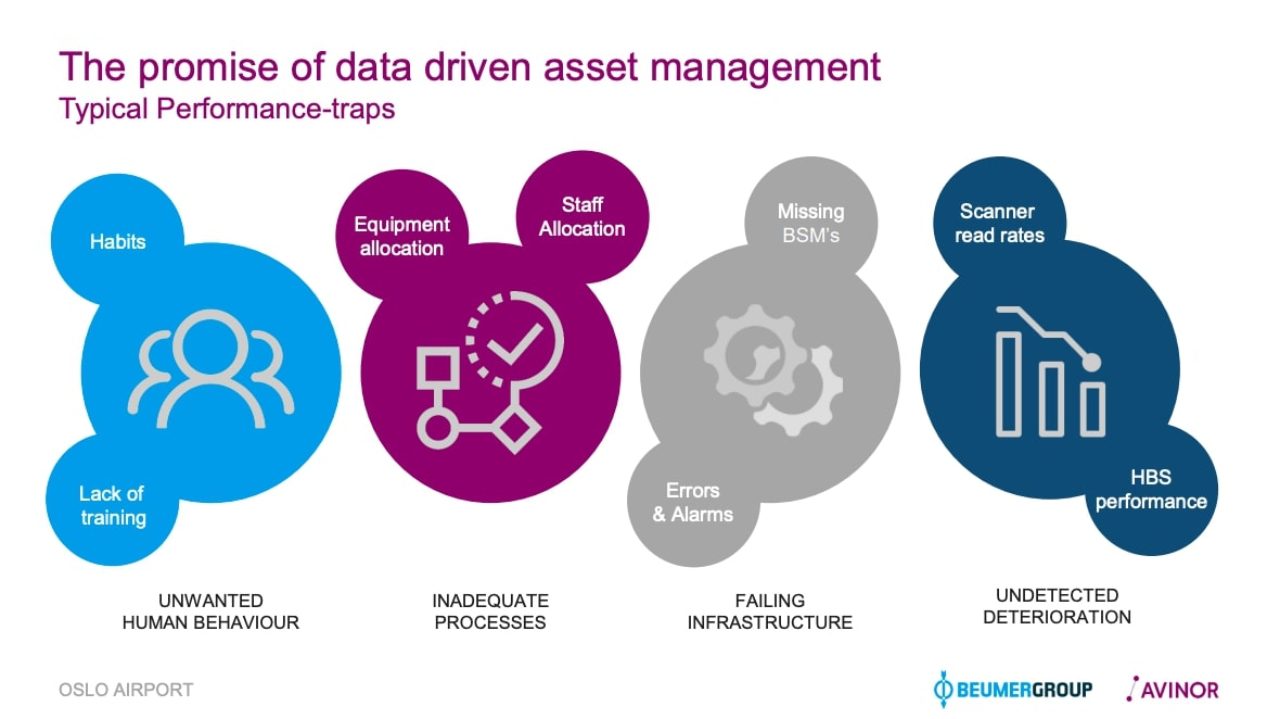
Avoiding four performance traps
Baggage handling systems, Sørgjerd observes, can fall victim to four common performance traps:
- Unwanted human behaviour – typically, bad habits and lack of training.
- Inadequate processes – a tendency to do today what we did yesterday when it comes to allocating equipment and staff, resulting in unused available capacity.
- Failing infrastructure – typically alerted through the airport’s SCALA system.
- Undetected deterioration – failures occurring in small, incremental and undetected steps that slowly eat away at capacity.