3 practical ways to use data in your CEP distribution centre’s live operations

Every distribution centre can benefit from digitalisation. Even in the early stages of digitalising their sortation processes, there’s vast potential for improving operations through the use of data, such as improving throughput, reducing operational risk and lowering costs per parcel. We will look at the practical ways in which three distribution centres are using data to support their live parcel sortation operations.

By BEUMER Group

Why digitalise your distribution centre?

But before getting to the distribution centres, why should distribution centres digitalise? What’s the value of data?

Improving operations of a distribution centre is much more than just adjusting system layouts, such as adding chutes, sorters and conveyor belts. Using data and analysing it to gain insights is a means for optimising the operations of distribution hubs.

And more and more hub owners are starting to understand the value of data, as they begin to shift their focus from a hardware-only view to a more holistic view.

The value of data

Distribution centres today can collect a lot of data from their systems. Sorter data can be taken from scanners, volumes systems, scales and cameras and asset data can be collected from the inductions, chutes and conveyors.

This data can then be added to operational data, collected from in and outbound movements, schedules, shifts, operators and workstations

By collecting and utilising all this data, distribution hubs can enrich their sortation systems to optimise their operations, resources and time – without having to change their physical systems.

Levels of digitalisation

There are different levels of digitalisation by which distribution centres can use their data. These four different stages of digital maturity can be described in this way:

  1. Manual: Information is written down and stored manually. Breakdowns are handled when they occur. Repairs or optimisations take place when they are required or when throughput drops noticeably.
  2. Basic (descriptive and diagnostic): Information from the system elements is stored digitally. Collected data describes how the system performs, providing understanding of what and why something happened. Operators react when digital predetermined conditions are met.
  3. Advanced (predictive): Data reveals patterns about general system performance, performance in specific situations and probable outcomes. Algorithms can predict on both operational and equipment levels.
  4. Full (prescriptive): The system foresees future problems and prescribes action – or carries out an action autonomously – to prevent and eliminate issues, such as potential bottlenecks.

How data can benefit a distribution centre

But even with a basic use of their data, distribution centres can start to see business process improvements and we will see this in the examples below.

Data can inform the distribution centre, for example, how many carriers were left idle during a period, how many times chutes were blocked, the amount of time induction units were running idle, the total percentage of unused sorter capacity, the capacity that was lost due to recirculations and the overall net sorter capacity that was utilised.

At a next level, an adaptive system would look at what to actually do and how to balance the system. For example, the system can reassign inbound trucks depending on which positions in the feed areas are experiencing low or high loads. Or the system can predict when chutes will be full before discharging items and assign operators accordingly, to prevent recirculations.

How 3 distribution centres have used data to optimise their operations

There are myriad ways in which distribution centres can leverage their data to improve their live operations. The following three cases illustrate just a few practical uses of data which have informed hub owners of ways they can refine their operation

Using a data visualisation dashboard to track weight and volume results

A central European CEP operator with multiple sites decided to transform its former manual process of monthly testing its scales and volume scanners into a digital process conducted automatically and in real time. The data from the tests is now presented in a centralised dashboard which is used by both the service team and management.

By digitalising this part of its operations, the operator ensures the tests are performed and saves on time and resources spent manually extracting and logging the data. Its data collection now also prevents revenue loss because it is able to invoice weights and volumes with more accuracy. It also engenders greater trust between itself and its customers.

Using cloud-based data analytics to optimise daily operations

A USA CEP operator now uses data from its multiple sortation centres to optimise its daily operations on an informed basis. Its cloud-based data analytics solution takes real-time data from the loop sortation systems at each of its sites, collecting throughput data from inductions and discharges, re-circulations, discharge failures, scanner performance and alarms.

Data analytics has also helped the operations managers make better decisions about how to assign the chutes in order to balance the system load more effectively. This assistance has been particularly constructive for the “young team” who were fairly new to the organisation.

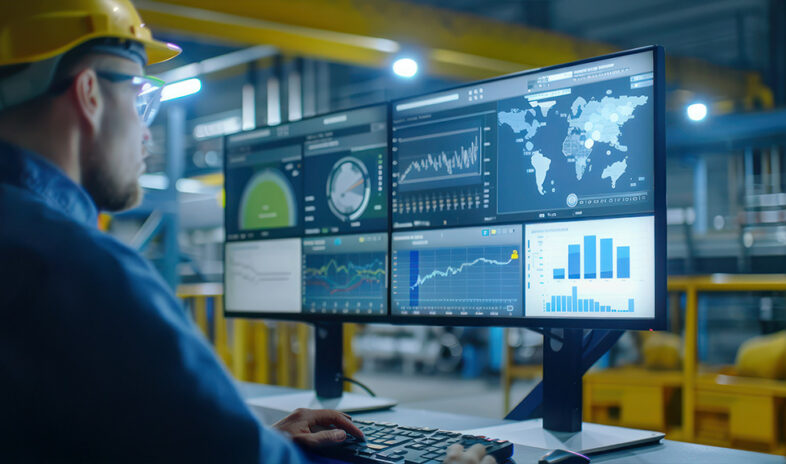
Through dashboards that are visible to all operations staff, the CEP provider now has transparency into all its processes and has been able to transform its operations from “what we think we know” to “what we know”. Meanwhile, its management team uses the data to measure KPIs and create forecast models for future performance, whether that’s week-over-week or year-over-year performance.

Using data to test and validate a new system design

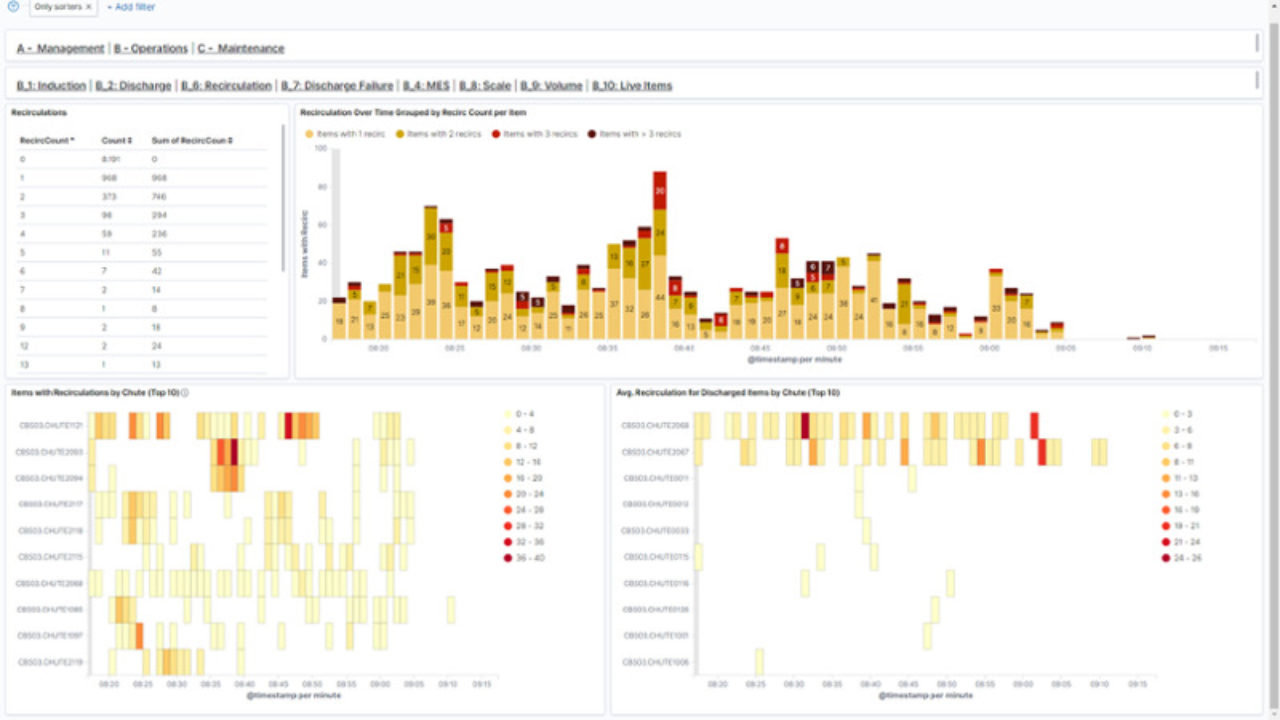
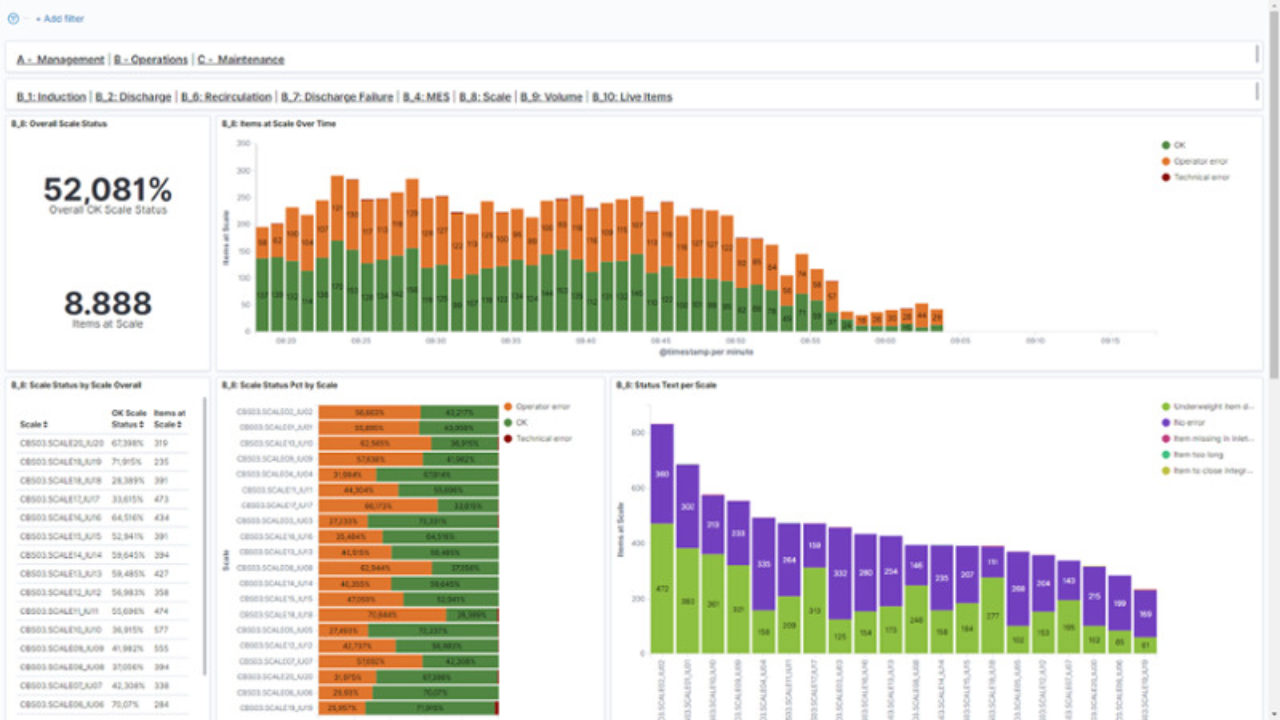
A large Scandinavian postal house was looking to extend its sortation system but was concerned its new system design would actually result in lost capacity as it would impact on the OCR/VCS process. So, its system design team used the system’s data to test whether the proposed design would lead to recirculation of the parcels.

Dashboards were able to show the timing of the OCR/VCS process, proving to the team that even in peak hours, the OCR/VCS system could respond to more than 95 percent of the parcels in less than the required 15 seconds. Through data testing, the team could confirm its system design was valid and viable.

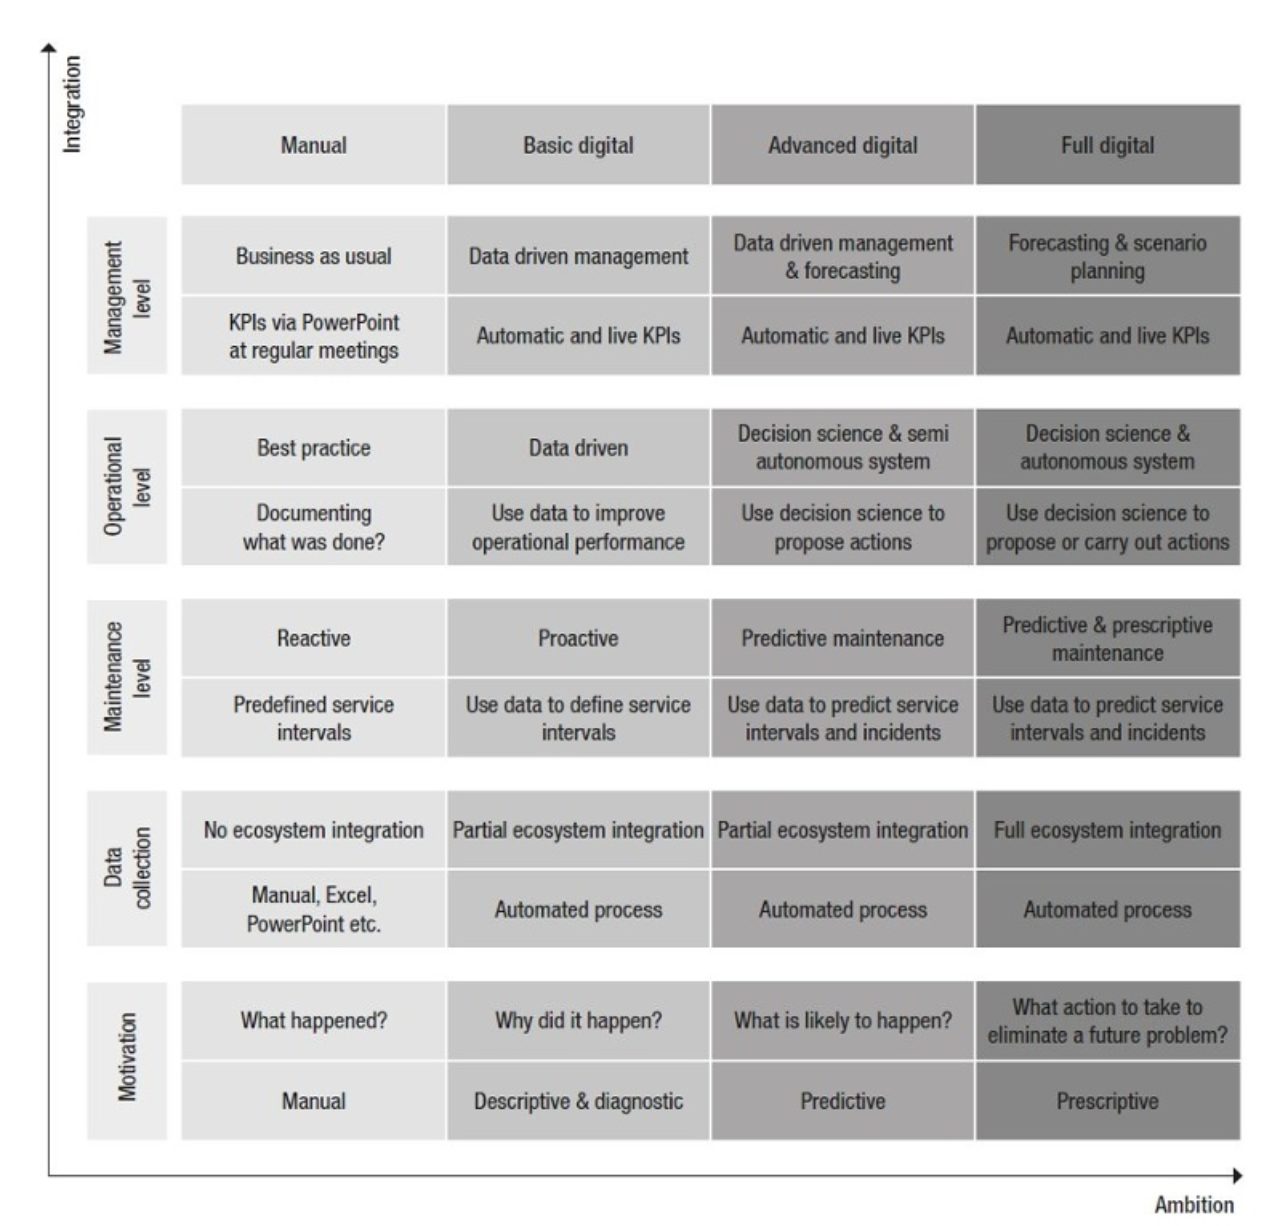
How ambitious does a distribution centre need to be?

But how ambitious does a distribution centre need to be before it benefits from utilising its data? To illustrate, let’s look at each of the three cases above:

  • Central European case: This operator was between the descriptive and predictive stage of data maturity. But even with a fairly basic level, it could still benefit on both the maintenance and operational levels.
  • US case: This operator was also at the descriptive stage of data maturity, using real-time data visualisation to help its operational staff use decision science to propose immediate actions that improve system operations on the fly.
  • Scandinavian case: This operator, too, was at the descriptive stage, yet its maintenance and operational staff could make an informed decision as early as the design stage of the proposed system extension.

The above examples are all at the basic end of digitalisation. Nevertheless, even this level of data maturity clearly offers benefits.

Moreover, these examples are just a small corner of the benefits a CEP operator will gain from logging and centralising data for visualisation and for making data-driven decisions. Imagine having a visualised overview of the complete system!

With data analytics, CEP operators can work more efficiently towards specific goals, in their roles as maintenance, operations, or management professionals. And with predictive and prescriptive analytics, digitalisation can go even further; predicting what is likely to happen and prescribing action to take to prevent future problems.

Conclusion

Digitalisation is first and foremost a strategic choice. Many organisations tend to fall in love with technology, followed by the need to find out where it can be applied. This approach will often meet cultural barriers and an internal struggle to communicate the ‘why’.

It’s much better to reverse the process and begin with the ‘why’. Why is it important for your organisation and what is your digital ambition? To find the answer it can be helpful to look at how digitalisation can not only help but also change the way an organisation works. How can the change affect the operation in a positive way? With this knowledge, the selection and implementation of the right technology becomes much easier.


Subscribe to our newsletter

Share