How to optimise throughput with parcel analytics

What does it actually look like when digitalisation is put to use in the CEP industry? In this article, we take you inside three distribution centres that adopted data analytics to solve specific operational problems they were facing. 

By Jan Schroeder


Historically, distribution centres have devoted many resources to the physical elements that go into building a high-speed sortation system.

Courier, Express, Parcel (CEP) distribution centres have invested in system designs featuring the best sorters, the best conveyor belts, the most effective chutes and so forth. A mindset that machines represent the only way to really optimise a sortation process is deeply rooted in the industry.

That might be changing, though.

Inside three sortation systems

In the following article, we take you inside three distribution centres that used data analytics to solve specific operational challenges.

We let you in on the challenges the distribution centres were struggling with and we show you how they began working with data and what they have since achieved.

Case #1: E-commerce distribution centre processing small B2C items

The first distribution centre is what you may call a typical B2C e-commerce parcel distribution centre.

The standard parcel mix consists of an almost endless variety of small and odd-sized consumer items. From selfie sticks to tiny cables to beauty accessories and everything in between. Generally speaking, low-cost items.

As is the norm with low-cost items, consumers tend to alternate between different webshops to save money. Price and delivery time are the deciding factors. As a result, webshops – the clients of the distribution centre – keep freight prices at a minimum. Consumers ideally want day to day-delivery or service close to it.

The distribution centre is met with high expectations. It needs to operate at a high and efficient pace. Delays are devastating and will impact the consumer’s verdict of the overall experience.

What were the problems that drove the distribution centre to consider digitalisation? Let’s take a look.

Problems:

  • Large number of chutes jammed by items
  • Sorter stops due to items between carriers
  • A large number of stray items on the sorter
  • A large number of stops on induction

Most errors were caused by the packaging or the shape or quality of items.

Three errors, in particular, seemed to reoccur: round or unstable items ended up between carriers; loose tape or wrapping got stuck on inductions; and wrapping caused items to stop in the inlet of chutes.

Increasingly frustrated by the same errors repeating themselves, managers at the distribution centre considered their options. They had to establish a more thorough understanding of the sortation system and the recurring incidents.

The company decided to go with data analytics and hired a systems provider to oversee their efforts.

Enormous amounts of data from the sortation system were detected and analysed. The complete processing journey of each item was mapped out.

Tape causing havoc

As data was analysed, every item became its own tale of how the sortation system was operated and how the system responded to certain events.

The number of tales continued to grow and so did the distribution centre’s understanding of why the same errors continued to occur.

For example, the distribution centre identified that one webshop had started to wrap products in tape. These were not difficult products to process per se. Identical products from other webshops were handled without difficulty. It was the tape itself that was causing issues. The distribution centre achieved this insight through data analytics and it positioned the distribution centre to work out a more desirable wrapping solution together with the client.

This was just one example of how data analytics improved operations. In the process, the distribution centre was also able to determine other kinds of connections between the items that were causing trouble and shippers, i.e. the distribution centre’s customers.

Data analytics allowed the company to:

  • Categorise customers based on the quality of wrapping
  • Open constructive and fact-based dialogue with customers to improve wrapping
  • Predict special handling for certain products
  • Adjust for specific time-of-day related issues
  • Train operators to work the system to its highest efficiency

The end result was fewer disruptions, a more efficient parcel flow and higher throughput. Not through investing in machinery. But through investing in data.

Case #2: Distribution of large and difficult-to-handle B2C items

The second CEP company specialises in handling large and somewhat impractical items. Items that most other distribution centres would prefer not to handle. Like a lawnmower or car parts or another piece of unwieldy machinery or equipment.

Clients of the distribution centre tend to be physical stores that also practice distance selling. Delivery times tend to be longer than regular e-commerce. Careful handling and delivery of items take priority over speed.

Which problems did this particular distribution centre struggle with?

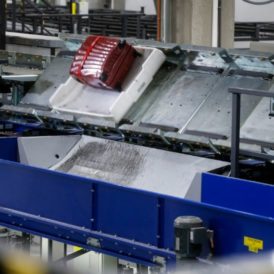
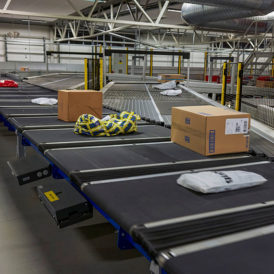
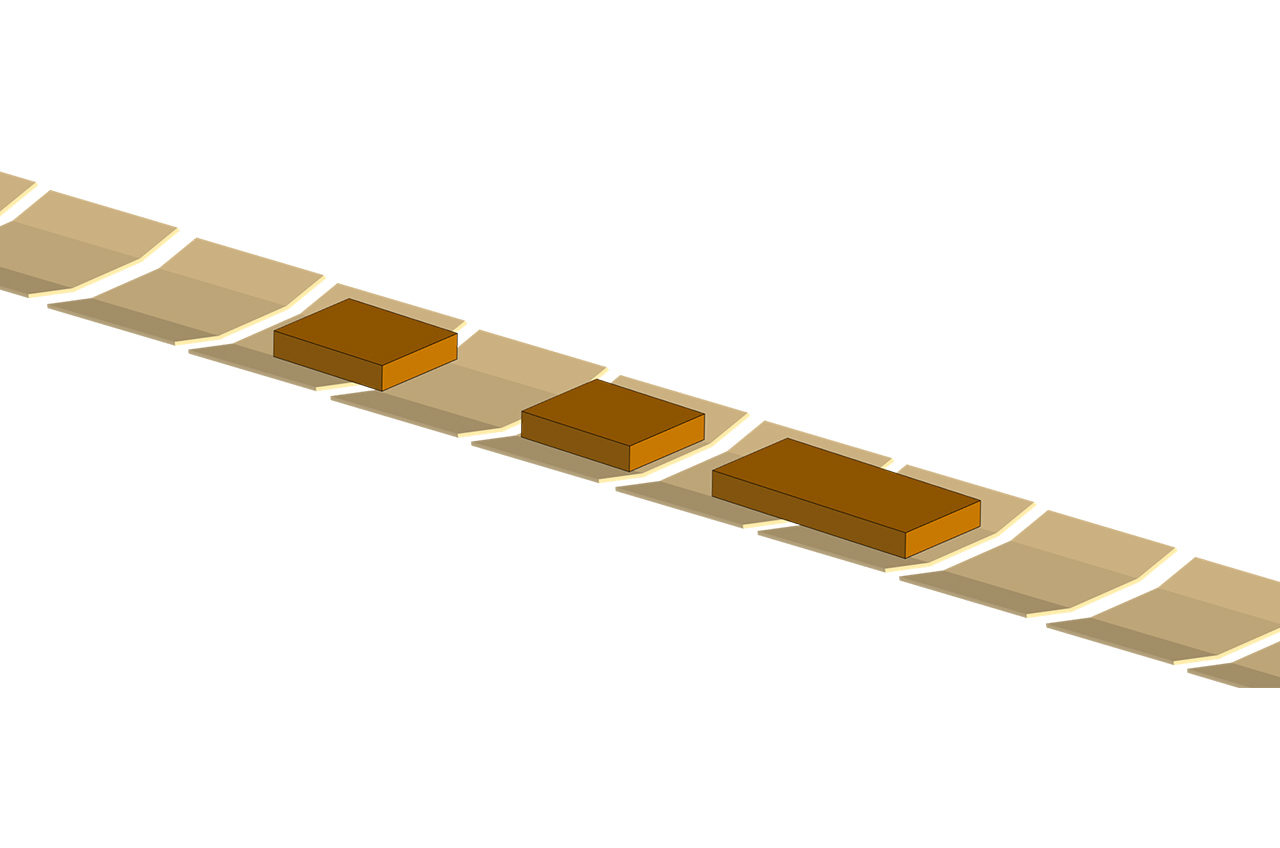
The parcel to the left is taking up two carriers despite being small enough to fit on one carrier only. Data analytics made the company realise that this mistake was taking place quite often as parcels were incorrectly placed on the in-feed line. A valuable insight that made the company teach operators to place parcels correctly.

Problems:

  • A large number of recirculated items
  • Too many items with very high carrier occupancy
  • A high amount of items in manual handling area needing rework

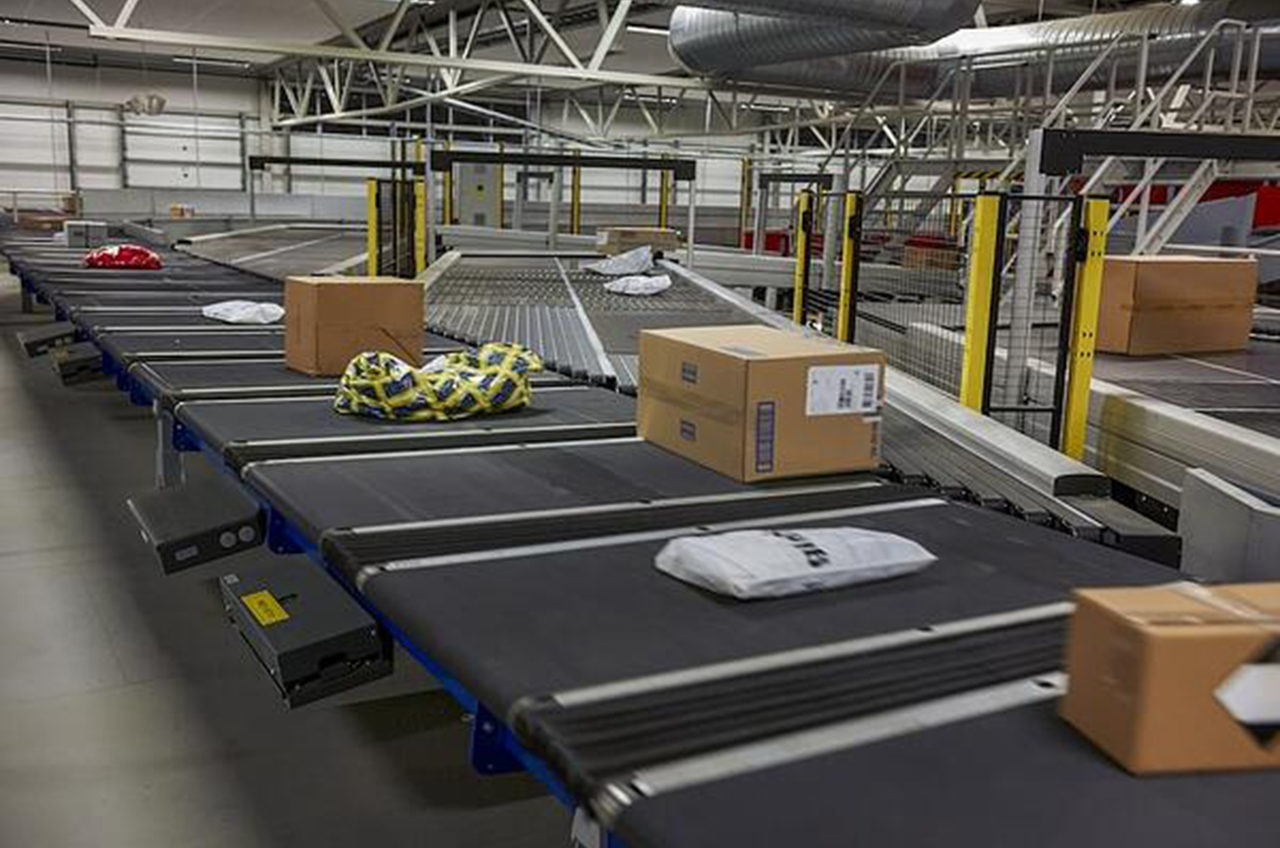
How the incidents happened was essentially a mystery. To the naked eye, the sortation system seemed to be working fine. But at the same time capacity was less than it should be.

So the CEP distributor engaged a systems provider and started collecting data.

Data revealed that items were recirculated because the chute was full or in a swap process. By knowing this, the company was able to make two important adjustments to their operation:

  • Doubling the resources allocated to the 10 percent of the chutes with the highest parcel flow
  • Implementing dynamic resource allocation to the remaining 90 percent of flow destinations

These two adjustments resulted in a vast reduction of recirculated parcels. Simply by operating the sortation system in a more effective manner. Without spending money on any new machinery.

Thanks to data analytics, the distribution centre made another stunning realisation:

The majority of the items inducted to two carriers were in fact small enough to fit on one carrier only, but they had been poorly placed on the in-feed line. It turned out that the distribution centre was able to lower the number of two-carrier occupancies significantly by focusing on training operators to place items correctly.

“The distribution centre was able to lower the number of two-carrier occupancies significantly.”

Less rework through better data

The company faced another operational challenge: insufficient parcel data interchange led to vast amounts of rework.

By cross-referencing reasons for rework with parcel data, the distribution centre identified that EDI (Electronic Data Interchange) was often too late, incorrect or downright faulty. With several parcels, the barcode quality was poor or the contents often incorrect.

Taking their data analytics one step further, the company mapped out the link between no-read items and shippers/customers. Customers were then categorised based on the quality of the EDI they were able to provide.

This insight paved the way for a dialogue between the CEP company and clients to determine a  solution to the issue. Also, the CEP company now had data for aligning the cost per delivery with quality of EDI.

The result was a better EDI, giving a smoother parcel process with much less rework and operator interventions.

Get the full overview: Read the Parcel distributors’ guide to digitalisation.

Case #3: Distribution of standard B2C parcels with delivery speed in focus

This case is about a prototypical B2C e-commerce distribution centre.

Its clients are webshops and the end user (receiver) is a consumer. Delivery speed and keeping cost per parcel at a minimum are two key priorities.

A curious example this one – and also an example of just how valuable data can be to a CEP company.

This distribution centre had a sortation system consisting of two sorters and both sorters put up some truly puzzling capacity levels.

The two sortation systems performed extremely well – with utilisation close to theoretical capacity. But the high system utilisation was not reflected as equally high productivity.

Impressive utilisation numbers is one thing, but something was amiss. The distribution centre faced two problems.

Problems:

  • The sortation system produced large amounts of rework
  • The sortation system produced large amounts of cross-over parcels between the two systems

To solve these issues the distribution centre considered investing in an additional crossover line. Thankfully they decided on a different solution.

Instead of investing in a re-design, the company invested resources in collecting data from the sortation system. This would prove to be significantly less expensive but also a much more efficient solution than spending on a new crossover line.

What the data revealed

It turned out there was a very good reason why the sorters put up such impressive capacity numbers. Something was indeed wrong.

More than half of the cross-over items crossed between the two systems more than once. Poorly inducted items resulted in 20 percent of the rework. And items which in fact had a valid destination represented more than 30 percent of rework.

As the distribution centre dug into the data, it discovered why the utilisation figures had been so unrealistically high: the two systems were misconfigured and crossed over items back and forth. In addition, the system was configured to reject parcels rather than looping to retry the sortation.

As a result, the combined throughput greatly exceeded the actual number of items going through the facility.

Based on these insights, the distribution centre identified the most efficient solutions:

  • Consistent allocation between the two sorters
  • Better staffing in the chute area
  • Double allocation for large throughput destinations
  • Dynamic allocation for low throughput destinations
  • Allowing items with a valid destination to recirculate
  • Training operators to induct items more carefully

Conclusion

The result was a much more effective system with less rework and only the necessary cross-over between systems. Better throughput was achieved without investing in any new and expensive machinery.

More and more CEP companies are warming up to the digital side of improving throughput. These three case stories tell us why.

Investing resources in data services can actually create high value for CEP operators. In fact, quite often digital services, including data analytics, will transform distribution centre operations by detecting  inefficiencies that would otherwise continue to occur – and at a lower cost than reworking the physical system design.

Do you want to know more about the potential of digitalisation for your distribution centre? Read our e-book about digitalisation for parcel distributors.


Subscribe to our newsletter

Share